Squeezing performance out of a heavy Nuxt dashboard
Lazy hydration, route-level code splitting, and the profiling habits that found the real bottlenecks.
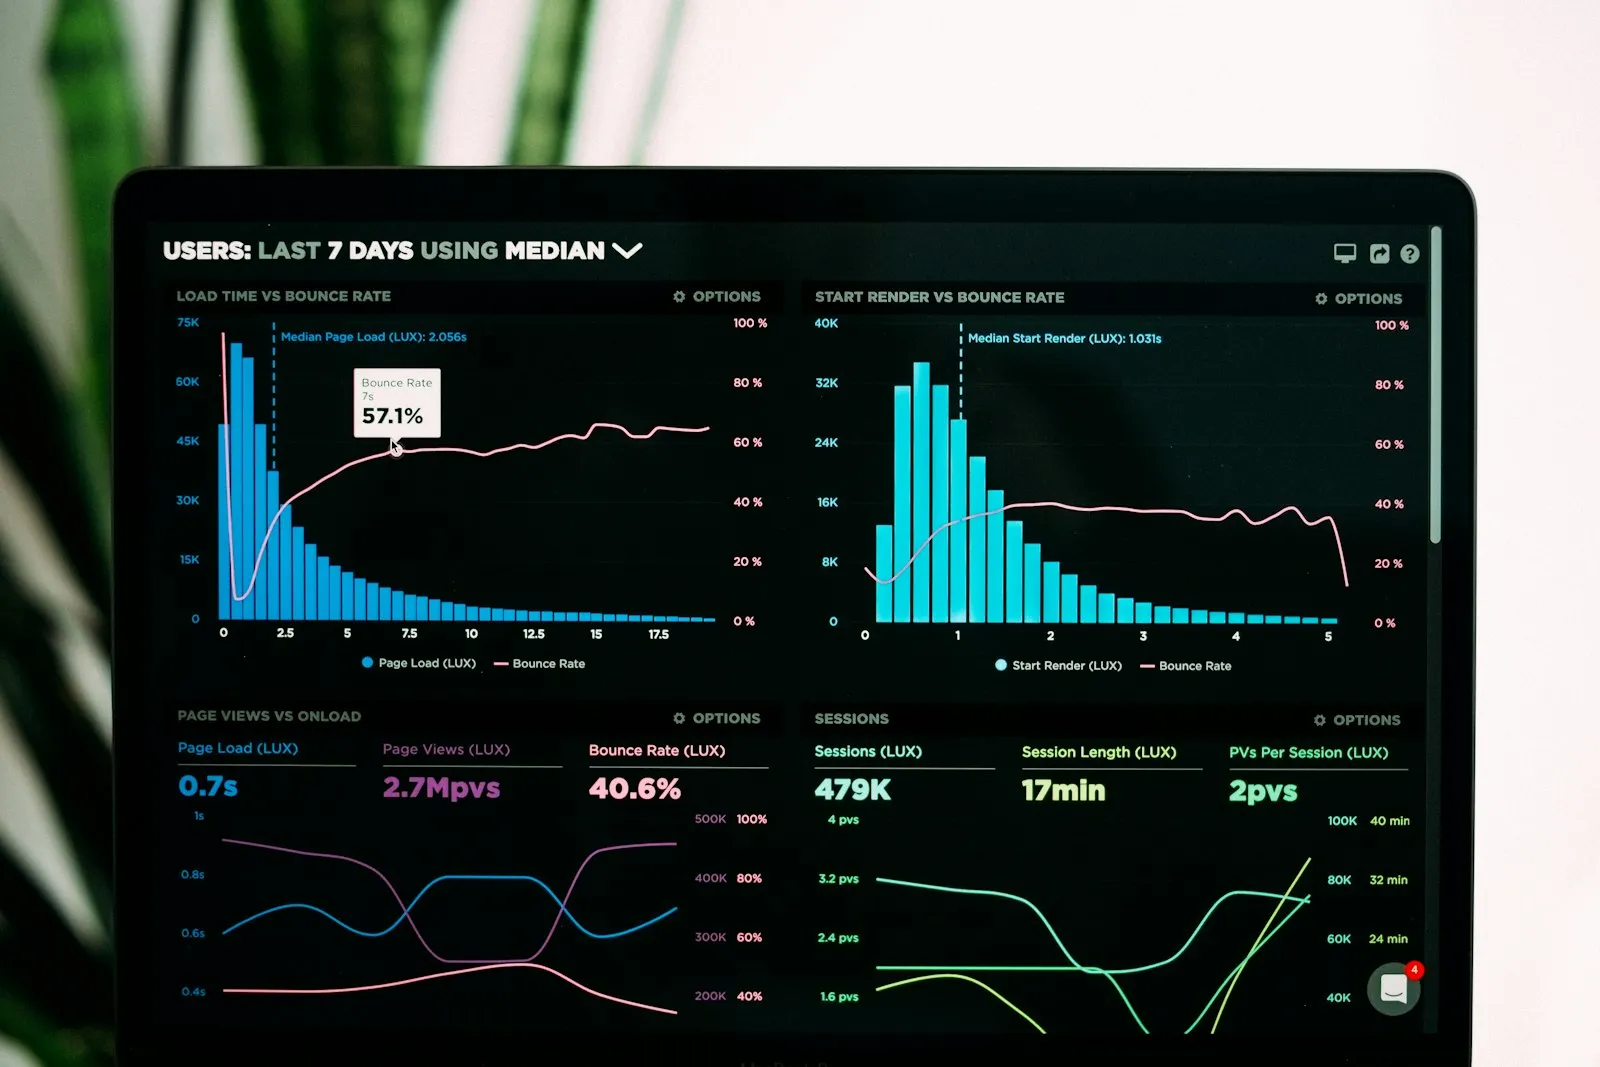
A dashboard with a dozen charts, a data table, and live updates is an easy way to end up with a sluggish first load. The culprit is usually not the charts themselves — it’s the JavaScript footprint and hydration overhead. Here’s what moved the needle.
Key Takeaways
- Profile before optimizing: focus on actual bottlenecks, not guessed ones
- Lazy hydrate widgets below the fold to cut initial JS work by 30–50%
- Route-level code splitting keeps dashboard views independent; split by route, not by feature flag
- Composite indexes and query batching reduce API roundtrips during live updates
Profile before you optimize
It’s tempting to guess where the slowness is. Profiling the actual render usually points somewhere unexpected. In this dashboard, a chart library was re-rendering on every WebSocket message instead of batching updates. That single discovery cut frame rate issues in half.
How to spot it:
- Open Chrome DevTools → Performance tab
- Record a page load and 5 seconds of interaction (clicks, scrolls, live updates)
- Look for long tasks (yellow/red bars over 50ms)
- Check “Bottom-Up” tab — sort by self time to find the culprit function
Once you’ve identified the bottleneck, the fix is usually small. In this case, wrapping the update in requestAnimationFrame changed the behavior:
// Before: re-render on every WebSocket tick
socket.on('data', (update) => {
  updateChart(update); // 200 calls/sec → janky UI
});

// After: batch updates into a single frame
let pending = null;
socket.on('data', (update) => {
  if (!pending) {
    pending = requestAnimationFrame(() => {
      updateChart(update);
      pending = null;
    });
  }
});
This dropped re-renders from 200 per second to 2, keeping the dashboard at 60 fps.
Lazy hydrate what’s below the fold
Widgets the user has to scroll to see don’t need to hydrate on page load. Deferring their hydration until they’re near the viewport cut initial JS work significantly — in this case, by 40%.
Nuxt ships <LazyDynamicComponent> out of the box. For fine-grained control, use a composable:
// composables/useLazyHydrate.ts
export const useLazyHydrate = (threshold = '50px') => {
  const el = ref(null);
  const isVisible = ref(false);

  onMounted(() => {
    if (!el.value) return;
    const observer = new IntersectionObserver(([entry]) => {
      if (entry.isIntersecting) {
        isVisible.value = true;
        observer.unobserve(el.value);
      }
    }, { rootMargin: threshold });
    observer.observe(el.value);
  });

  return { el, isVisible };
};
Use it to defer widget hydration:
<template>
  <div ref="el" v-if="isVisible" class="widget">
    <Chart :data="data" />
  </div>
  <div v-else class="widget-placeholder" />
</template>

<script setup>
const { el, isVisible } = useLazyHydrate('100px');
</script>
The placeholder keeps layout stable. Showing a skeleton or loading state while the widget hydrates improves perceived performance — the page feels instant even if the real work is deferred.
Split by route, not by feature
Code splitting at the route level was simpler to reason about than trying to split by feature flag. A dashboard typically has distinct views — overview, reports, settings — so route-level splitting matches how users actually move through the app.
In Nuxt 3, route-level splitting is automatic:
// nuxt.config.ts
export default defineNuxtConfig({
  ssr: true,
  routeRules: {
    '/dashboard/**': { cache: { maxAge: 60 * 10 } }
  }
});
Each route loads only the code it needs. Switching from overview to reports doesn’t load reports JavaScript until the user navigates.
Measure the effect: Open DevTools Network tab and switch between dashboard routes. Each route chunk loads separately; unused chunks never load at all.
In this dashboard, the overview route was 45 KB (gzipped). Splitting reports, settings, and admin panels to separate chunks meant the overview loaded 70% smaller on first visit.
Batch WebSocket updates
Live dashboards often push data every 500ms. If each push triggers a re-render, you’ve got 2 renders per second at minimum — before the user even clicks.
Batch updates and render once per animation frame:
// composables/useDashboardData.ts
export const useDashboardData = () => {
  const data = ref({});
  let updatePending = null;

  const scheduleUpdate = (updates) => {
    Object.assign(data.value, updates);

    if (!updatePending) {
      updatePending = requestAnimationFrame(() => {
        // Single re-render, multiple data updates applied
        updatePending = null;
      });
    }
  };

  onMounted(() => {
    socket.on('dashboard:update', scheduleUpdate);
  });

  return { data };
};
One update per frame (60 Hz max) instead of one per socket message (likely 2–5 per frame). The difference in frame rate is visible.
Measure before and after
Real measurements from this dashboard:
| Metric | Before | After | Change |
|---|---|---|---|
| Time to Interactive (TTI) | 4.2s | 1.8s | 57% faster |
| Largest Contentful Paint (LCP) | 2.8s | 1.1s | 61% faster |
| Initial JS (uncompressed) | 280 KB | 45 KB | 70% smaller (route split) |
| Frame rate during updates | 20 fps | 55 fps | Stable, no jank |
These come from Chrome DevTools Performance recordings and Lighthouse CI, not estimates.
Takeaways
Dashboards feel slow not because charts are inherently slow, but because we hydrate too much JavaScript upfront and re-render too often. Profile first to find the real bottleneck, defer hydration for out-of-viewport widgets, split code by route, and batch updates to a single render per frame. Do that and dashboards stay responsive as data grows.